 DanFin
Drawdown Distribution: Why Prop Firm Challenges Punish High Variance
In short
- Your worst drawdown is not a single number. Run the same strategy many times and it becomes a distribution of possible outcomes.
- Two strategies with the exact same edge can have completely different drawdown distributions. Variance is what separates them.
- A prop firm challenge is a hard wall: cross the max drawdown once and you are out. So the tail of the distribution, not the average, decides whether you pass.
- That is why challenges reward low-variance strategies. High reward-to-risk looks great on paper and blows accounts in practice.
- See it on your own strategy in the simulator, which runs this same Monte Carlo against any firm's real rules.
Two traders, Person A and Person B, have exactly the same edge. Over thousands of trades they both make about twenty cents for every dollar they risk. On a spreadsheet they are identical. Yet Person A keeps passing prop firm challenges and Person B keeps blowing them, one after another, and he cannot understand why.
The difference is not their edge, it is the shape of their drawdowns. Person A runs a low-variance strategy: a high win rate with small winners, so her equity curve is steady and boring. Person B runs a high-variance strategy: he swings for big reward-to-risk trades and is often underwater, waiting for the one runner that pays for everything. Same expected return, very different ride. And a prop firm challenge cares enormously about the ride.
To see why, you have to stop thinking about drawdown as one number and start thinking about its distribution.
Claim your spot on the waitlist
I am releasing one of my trading strategies shortly. Join the waitlist and receive a discount at launch.
Claim your spot →What drawdown actually is
Drawdown is how far your account has fallen from its most recent high. If you climb to 105,000 dollars and slip back to 99,000, you are in a 6,000 dollar drawdown from that peak. The maximum drawdown of a run is simply the deepest of those falls over the whole period, the worst moment your equity had.
It matters because it is the number that ends accounts. A drawdown limit, once breached, is final, there is no earning it back. On a prop firm challenge the maximum drawdown is not a statistic to review afterwards, it is a live wall you must never touch.
Why one backtest lies to you
Here is the trap. A backtest shows you a single history: one particular order of wins and losses that happened to occur. But that order was luck. Shuffle the same trades into a different sequence and the story changes completely. Get your losing streak early, before you have built a cushion, and the drawdown is brutal. Get it late and it barely registers. Your real backtest drawdown was just one roll of the dice.
Monte Carlo simulation fixes this. Instead of trusting one sequence, it replays your strategy thousands of times, each with a fresh random order of wins and losses drawn from your win rate and reward-to-risk, and records the worst drawdown of every single run. Collect all of those numbers and you get the drawdown distribution: not one figure, but the full spread of what your worst drawdown could realistically be.
Same edge, different distribution
Now back to Person A and Person B. Give them both a genuine positive edge of the same size, run each strategy forty thousand times over a hundred-trade stretch, and plot the worst drawdown from every run. Person A trades a 60% win rate at 1:1 reward-to-risk. Person B trades a 30% win rate at 1:3. On paper their edge per trade is identical. Their drawdown distributions are not.
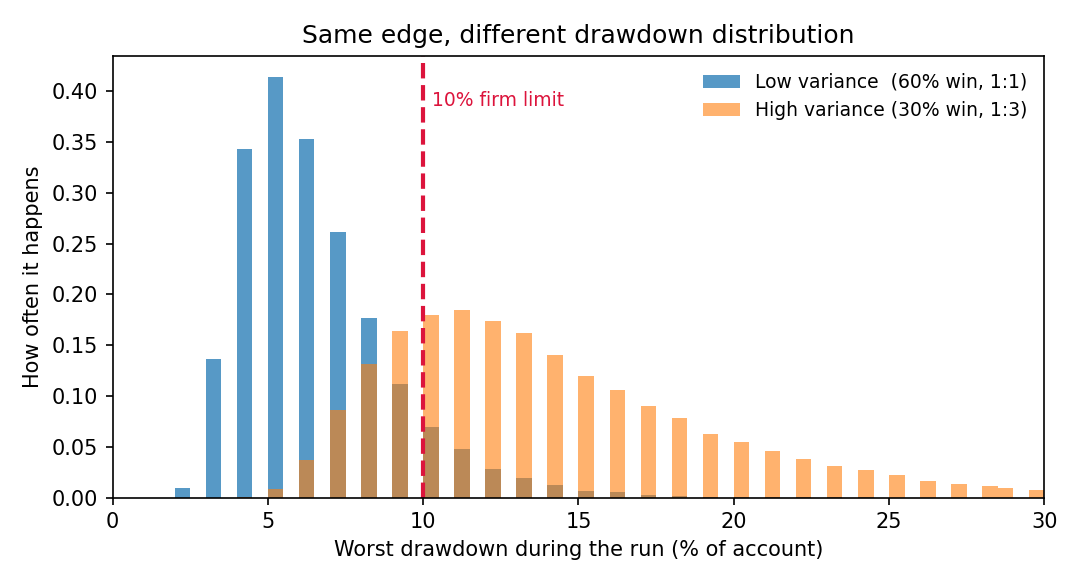
Person A's distribution is a tight hill. Most of her attempts have a worst drawdown around 6%, and only about one in ten ever reaches 10%. Person B's is a wide, flat smear pushed far to the right: his typical worst drawdown is around 13%, and the tail stretches past 25%. Both traders have the same edge. Only one of them keeps his drawdowns small and predictable.
The tail is what fails you, not the average
This is the part most traders miss. A prop firm does not fail you on your average drawdown. It fails you on your worst one, on the single deepest dip across the whole challenge. So the number that matters is not the middle of the distribution, it is the right-hand tail, the rare bad runs.
Look again at where each distribution sits relative to the dashed red line, the 10% limit. Person A's tail barely reaches it. Person B's whole right half is on the wrong side of it. Even though his average trade is just as profitable, his drawdown distribution spills past the wall again and again, and every one of those runs is a failed challenge. His edge never gets the chance to pay off because variance ends the attempt first.
Why prop firms punish variance
To make the point unmistakable, take five strategies that all share the same edge, and vary only their reward-to-risk from a safe 1:0.5 up to a wild 1:5. Then ask a single question of each: what is the chance its worst drawdown breaches a 10% limit?
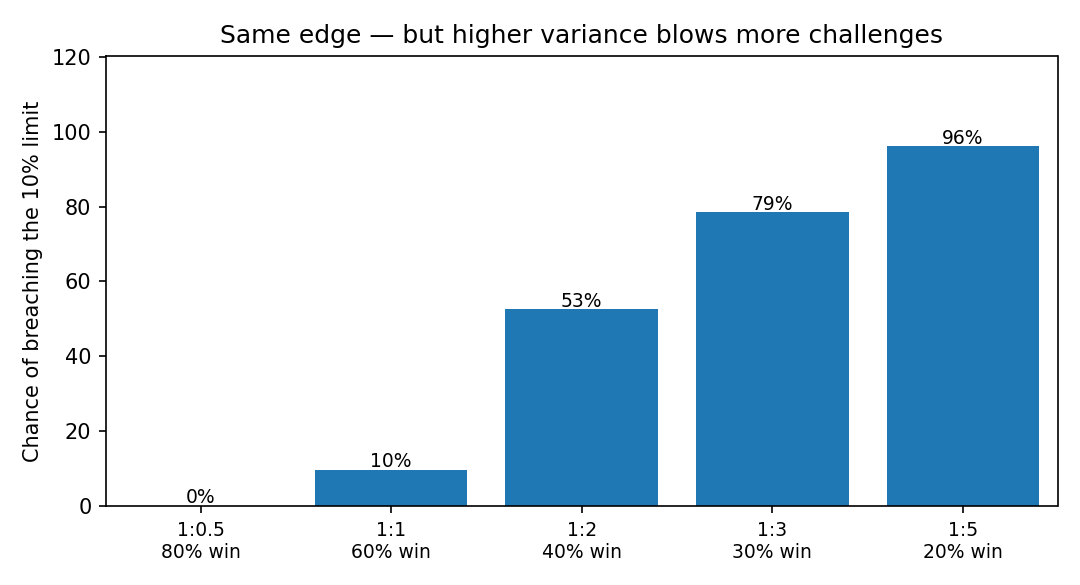
The climb is dramatic. The 1:0.5 grinder essentially never breaches. At 1:1 it is one in ten. By 1:2 it is a coin flip, at 1:3 it is four in five, and the 1:5 hero blows the challenge 96% of the time, all while carrying the identical edge as the strategy that almost never fails. Nothing changed except variance, and variance is exactly what a fixed drawdown wall is built to punish.
Back to Person B
So Person B was never unlucky, and he was never wrong about his edge. His strategy simply produces a drawdown distribution whose tail lives on the far side of the wall. Every challenge he takes is a fresh draw from that distribution, and most draws land him past the limit before his winners arrive. Person A, with the same edge and a tighter distribution, draws numbers that almost always sit under the wall. The wall does not reward the better trader. It rewards the one with less variance.
How to lower your variance for a challenge
The good news is that variance is something you can control, often without touching your edge. A few levers pull the whole distribution to the left, away from the wall:
- Lower your risk per trade. This is the biggest one. Halving your position size roughly halves the width of your drawdown distribution, moving the entire curve toward zero. The free Kelly calculator gives you a sensible per-trade number to start from.
- Favour higher win rates over huge reward-to-risk during the challenge. A 1:1.5 setup that hits often keeps you off the wall far better than a 1:4 lottery, even at the same expectancy.
- Avoid stacking correlated trades. Three positions that all depend on the same move are really one big bet, and they fatten the tail.
- Size against the drawdown buffer, not the balance. Your true bankroll on a challenge is the drawdown you are allowed to lose. Our Kelly criterion guide shows how to turn that into a per-trade number.
None of this makes you a worse trader. It makes your drawdown distribution narrow enough to fit under the firm's wall, which is the entire game during an evaluation.
The only way to know where your own strategy really sits is to look at its distribution, not its average. That is what DanFin's free prop firm simulator is built for. You enter your win rate and reward-to-risk, pick a firm, and it runs this same Monte Carlo right in your browser, then shows your full drawdown distribution against that firm's real limit, along with the odds your tail spills past the wall. A few seconds there beats finding out the hard way with real money on the line.
See your own recovery odds
The free drawdown recovery calculator runs this same Monte Carlo on your win rate and average win and loss, then shows your real odds of recovering, the gain needed, how long it takes, and your risk of blowing the account first.
Open the drawdown recovery calculator →Summary
- Your worst drawdown is a distribution, not a number. Monte Carlo reveals its full spread.
- Two strategies with the same edge can have very different distributions. Variance is the difference.
- A prop firm fails you on your worst drawdown, so the tail of the distribution decides your challenge.
- Higher reward-to-risk means higher variance means a fatter tail past the wall, even at equal edge.
- Lower your risk per trade and your variance to slide the whole distribution under the limit, then check it in the simulator.